Portail:Sciences de la Terre et de l'Univers
Portail des sciences de la Terre et de l'Univers
Les dernières modifications des 81 061 articles du portail.
402 catégories
Version pour appareil mobile
Présentation
Les sciences de la Terre (aussi appelées géosciences) désignent l'ensemble des sciences dont les études sont relatives à la planète Terre. Elles se décomposent en divers groupes de sciences, chacun étant relatif à l'une des quatre « sphères » composant la Terre : l'atmosphère, l'hydrosphère, la lithosphère et la biosphère. Alliant travail de terrain, expérimentation et théorisation, les sciences de la Terre ont pour principal objectif de décrire et d'expliquer le fonctionnement des différentes enveloppes terrestres et de caractériser leurs interactions mutuelles. Par ailleurs, de nombreuses disciplines des sciences de la Terre trouvent aussi des applications dans les domaines de l'économie et de la société, comme la gestion de l'environnement, des risques naturels ou l'approvisionnement en ressources naturelles.
Les sciences de l'Univers regroupent les différentes sciences traitant de l'Univers, de ses propriétés et de ses objets. Elles sont constituées de diverses spécialités, chacune étudiant un type de corps ou d'ensemble de corps constitutif de l'Univers. Ces sciences font appel à de nombreux et lourds dispositifs d'observations, situés à la fois sur Terre et dans l'espace et ont nécessité le développement de technologies spécifiques qui trouvèrent des applications a-posteriori au sein des sociétés modernes.
Les sciences de la Terre et de l'Univers sont nées de la nécessité pour l'Homme de comprendre le fonctionnement de son environnement et de déterminer ses origines. Ces sciences sont caractérisées par une interdisciplinarité et une interconnectivité importantes, utilisant principalement les théories et les principes de la physique, de la chimie et des mathématiques. Si les avancées dans les sciences de l'Univers permettent une meilleure compréhension de certains aspect des sciences de la Terre, ces dernières servent également d'analogues dans les études de corps célestes autres que la Terre.Lumière sur…
L’éruption du mont Saint Helens en 1980, dans l'État de Washington, est l’éruption volcanique la plus importante jamais enregistrée aux États-Unis dans les 48 États contigus. Avec un indice d’explosivité volcanique de 5 et 1,2 km3 de matière rejetée, elle a dépassé en puissance destructrice et en volume de matière rejetée l’éruption de 1915 du pic Lassen en Californie.
L’éruption fut précédée par deux mois de séries de tremblements de terre et de jets de vapeur résultant de l’infiltration de magma à faible profondeur en dessous de la montagne. Le magma provoqua un réseau de fractures et de déformations dans la face nord du volcan. Le à 8 h 32, un tremblement de terre déclencha un glissement de terrain majeur sur la face nord, exposant du même coup la roche à moitié en fusion, riche en gaz et en vapeur, à des pressions plus basses. En moins de vingt secondes le magma explosa sous forme d’un mélange de matériaux volcaniques très chauds. Cette nuée ardente se dirigea vers le lac Spirit à une vitesse telle qu’elle dépassa rapidement le glissement de terrain de la face nord.
Une colonne de cendres s’éleva alors dans l’atmosphère pour retomber sur le territoire de onze États américains. Dans le même temps, la neige et la glace de plusieurs glaciers présents sur le sommet se mirent à fondre, causant d’importantes coulées de boue, les lahars, qui atteignirent le lit de la rivière Columbia. Des épisodes volcaniques suivirent le lendemain, ainsi que des éruptions moins destructrices au cours de l'année 1980.
On dénombra 57 morts, dont le géologue David A. Johnston. Des milliers d’animaux furent tués. Près de trois milliards de mètres cubes de roches (l’équivalent d’un cube de 1 400 m de côté) dévalèrent en avalanche le versant nord et comblèrent en grande partie la vallée de la rivière Toutle. Sur une étendue de 380 km2, les forêts furent remplacées par des collines arides et grises. Les dégâts furent estimés à 2 ou 3 milliards de dollars US de l'époque et le mont Saint Helens affichait désormais une plaie béante sur sa face nord. La zone est depuis préservée en l’état, dans le cadre du Mount St. Helens National Volcanic Monument.
Articles labellisés
![]() Articles de qualité (17)
Articles de qualité (17)
![]() Bons articles (11)
Bons articles (11)
Image au hasard
Le saviez-vous ?
- L'expansion de l'Univers est une conséquence générique des lois de la relativité générale.
- Le forage sg3, à Zapoliarny, est le plus profond forage jamais réalisé, en atteignant la profondeur de 12 262 m.
Sciences de l'Univers
Articles principaux : Astronomie et Astrophysique
Corps célestes
Voie lactée
- Astronomie galactique
Extra-galactique
Univers
Vie dans l'Univers
Astronomie fondamentale
Sciences de la Terre
Atmosphère
Hydrosphère
Lithosphère
-
Géologie :
- Géologie structurale
- Géomorphologie
- Minéralogie
- Pétrologie
- Sédimentologie
- Stratigraphie
- Tectonique
- Volcanologie
- Sciences des sols :
- Édaphologie
- Pédologie
- Spéléologie
Géosystèmes
-
Géochimie :
- Biogéochimie
- Chimiostratigraphie
- Géochimie organique
- Géologie isotopique
- Océanographie chimique
- Géophysique :
Biosphère
Représentation de la Terre
- Cartographie
- Géographie
- Géostatistique
L'Univers et la Terre
-
Filament galactique
-
Superamas de galaxies
- Amas de galaxies
-
Nuage de galaxies
- Galaxie : Classification des galaxies (elliptique, spirale, irrégulière, naine) • Milieu interstellaire
- Galaxie active : Blazar • Quasar
-
Superamas de galaxies
- Types d'étoiles :
- Fin d'une étoile : Nébuleuse planétaire • Supernova • Rémanent de supernova
- Objets : Planète (Exoplanète) • Satellite naturel
Lithosphère
-
Croûte
- Croûte continentale
- Croûte océanique
- Lithosphère
- Asthénosphère
- Manteau
- Noyau externe
- Noyau interne
- Planètes : Mercure • Vénus • Mars • Jupiter • Saturne • Uranus • Neptune
- Planètes naines : Cérès • Pluton • Hauméa • Makémaké • Éris
- Satellites naturels : Lune • Galiléens • Titan • Triton • Charon
- Petits corps : Astéroïde • Comète
- Classes orbitales : Ceinture principale • Ceinture de Kuiper • Nuage d'Oort
Aller plus loin
Médias utilisés sur cette page
Auteur/Créateur: Elegant Themes, Licence: GPL
We’ve designed a 192 piece set of flat icons, and they are all yours, for free! The icons come in two versions: full color and single color, for a total of 384 variations. This download includes .ai, .eps, .pdf, and .png (64px and 128px). Below is the full set in both styles. These icons are completely free and Open Source under the GPL, so feel free to use them in your personal and commercial projects alike. We are on a mission to create the best collection of Open Source graphics on the web, so that the WordPress ecosystem can use and enjoy them alongside the freedoms they have become accustomed to. Stay tuned for more great stuff!
Auteur/Créateur: Fork of free file File:Celestia.png, Licence: GPL
Image of the planet Jupiter and one of its moons
Auteur/Créateur: Luis Fernández García, Licence: CC BY-SA 3.0
Énergie entrante (rose) et sortante (jaune). Les surfaces sont équivalentes pour symboliser l'équilibre énergétique.
Auteur/Créateur: Elegant Themes, Licence: GPL
Water drop icon / symbol: One white drop in a (light) blue, round disc. We’ve designed a 192 piece set of flat icons, and they are all yours, for free! The icons come in two versions: full color and single color, for a total of 384 variations. This download includes .ai, .eps, .pdf, and .png (64px and 128px). Below is the full set in both styles. These icons are completely free and Open Source under the GPL, so feel free to use them in your personal and commercial projects alike. We are on a mission to create the best collection of Open Source graphics on the web, so that the WordPress ecosystem can use and enjoy them alongside the freedoms they have become accustomed to. Stay tuned for more great stuff!
Ocean basins mapped with satellite altimetry. Seafloor features larger than 10 km are detected by resulting gravitational distortion of sea surface.
Auteur/Créateur: Angelus (talk), Licence: CC BY-SA 3.0
Cette image vectorielle non W3C-spécifiée a été créée avec Inkscape .
Auteur/Créateur: Original téléversé par Mikenorton sur Wikipédia anglais., Licence: CC-BY-SA-3.0
Block diagram of a monocline, for a new monocline article. Self-made.
Auteur/Créateur: Original téléversé par Carlo denis sur Wikipédia français., Licence: CC-BY-SA-3.0
Logo créé par l'Carlo Denis pour le portail « Géodésie et Géophysique ». L'arrière-fond est constitué par une image de la NASA mise dans le domaine public.
Auteur/Créateur: Dilshad Roshan, Licence: CC BY-SA 4.0
Malayattoor - teak plantation
This image, called the Hubble eXtreme Deep Field (XDF), combines Hubble observations taken over the past decade of a small patch of sky in the constellation of Fornax. With a total of over two million seconds of exposure time, it is the deepest image of the Universe ever made, combining data from previous images including the Hubble Ultra Deep Field (taken in 2002 and 2003) and Hubble Ultra Deep Field Infrared (2009).
The image covers an area less than a tenth of the width of the full Moon, making it just a 30 millionth of the whole sky. Yet even in this tiny fraction of the sky, the long exposure reveals about 5500 galaxies, some of them so distant that we see them when the Universe was less than 5% of its current age.
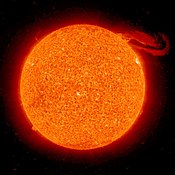
The Hubble eXtreme Deep Field image contains several of the most distant objects ever identified.The STEREO (Ahead) spacecraft observed this visually stunning solar prominence eruption on September 29, 2008, in the 304 angstrom wavelength of extreme UV light. Prominences are relatively cool clouds of gas suspended above the sun and controlled by magnetic forces. The prominence rose and cascaded to the right over several hours, appearing something like a flag unfurling, as it broke apart and headed into space. The prominence is composed of ionized Helium that is about 60,000 degrees Kelvin.
Auteur/Créateur: Christine Zenino from Chicago, US, Licence: CC BY 2.0
Tasiilaq Greenland is an icy wonderland inhabited by teams of sled dogs, colossal glaciers, and home to the world's second largest ice sheet.
Read my article at Suite101: Tasiilaq Greenland Travel Guide www.suite101.com/content/tasiilaq-greenland-travel-guide-...Mammoth image from US National Parks Servie - converted from .gif
More than 12 billion years of cosmic history are shown in this unprecedented, panoramic, full-color view of thousands of galaxies in various stages of assembly.
This image, taken by NASA's Hubble Space Telescope, was made from mosaics taken in September and October 2009 with the newly installed Wide Field Camera 3 (WFC3) and in 2004 with the Advanced Camera for Surveys (ACS). The view covers a portion of the southern field of a large galaxy census called the Great Observatories Origins Deep Survey (GOODS), a deep-sky study by several observatories to trace the formation and evolution of galaxies.
The final image combines a broad range of colors, from the ultraviolet, through visible light, and into the near-infrared. Such a detailed multi-color view of the universe has never before been assembled in such a combination of color, clarity, accuracy, and depth.
Hubble's sharp resolution and new color versatility, produced by combining data from the two cameras, are allowing astronomers to sort out the various stages of galaxy formation. The image reveals galaxy shapes that appear increasingly chaotic at each earlier epoch, as galaxies grew through accretion, collisions, and mergers. The galaxies range from the mature spirals and ellipticals in the foreground, to smaller, fainter, irregularly shaped galaxies, most of which are farther away, and therefore existed farther back in time. These smaller galaxies are considered the building blocks of the larger galaxies we see today.
Astronomers are using this multi-color panorama to trace many details of galaxy assembly over cosmic time, including the star-formation rate in galaxies, the rate of mergers among galaxies, and the abundance of weak active galactic nuclei.
The image shows a rich tapestry of 7,500 galaxies stretching back through most of the universe's history. The closest galaxies seen in the foreground emitted their observed light about a billion years ago. The farthest galaxies, a few of the very faint red specks, are seen as they appeared more than 13 billion years ago, or roughly 650 million years after the Big Bang. This mosaic spans a slice of space that is equal to about a third of the diameter of the full Moon (10 arcminutes).
The new Hubble view highlights a wide variety of stages in the galaxy assembly process. Ultraviolet light taken by WFC3 shows the blue glow of hot, young stars in galaxies teeming with star birth. The orange light reveals the final buildup of massive galaxies about 8 billion to 10 billion years ago. The near-infrared light displays the red glow of very distant galaxies — in a few cases as far as 12 billion to 13 billion light-years away — whose light has been stretched, like a toy Slinky, from ultraviolet light to longer-wavelength infrared light due to the expansion of the universe.
In this ambitious use of Hubble's observing time, astronomers used 96 Hubble orbits to make the ACS optical observations of this slice of the GOODS field and 104 orbits to make the WFC3 ultraviolet and near-infrared exposures. WFC3 peered deeper into the universe in this study than comparable near-infrared observations from ground-based telescopes. This set of unique new Hubble observations reveals galaxies to about 27th magnitude in brightness over a factor of 10 in wavelength. That's over 250 million times fainter than the unaided eye can see in visual light from a dark ground-based site.Auteur/Créateur: ESO/S. Brunier, Licence: CC BY 4.0
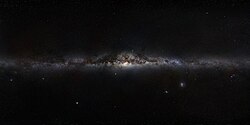
La voie lactée vue depuis la terre. Image obtenue en assemblant des photos couvrant l'ensemble de la sphère céleste. Ces photos ont été, pour la plupart, prises depuis les sites de l'Observatoire Européen Austral (ESO) sur le mont Paranal et à la Silla au Chili. Le panorama final correspond à 120 heures d'observations, étalées sur plusieurs semaines[1].
This composite image shows the massive galaxy cluster MACS J0717.5+3745 (MACS J0717, for short), where four separate galaxy clusters have been involved in a collision — the first time such a phenomenon has been documented. Hot gas is shown in an image from NASA's Chandra X-ray Observatory, and galaxies are shown in an optical image from the NASA/ESA Hubble Space Telescope. The hot gas is colour-coded to show temperature, where the coolest gas is reddish purple, the hottest gas is blue, and the temperatures in between are purple.
The repeated collisions in MACS J0717 are caused by a 13-million-light-year-long stream of galaxies, gas, and dark matter — known as a filament — pouring into a region already full of matter. A collision between the gas in two or more clusters causes the hot gas to slow down. However, the massive and compact galaxies do not slow down as much as the gas does, and so move ahead of it. Therefore, the speed and direction of each cluster's motion — perpendicular to the line of sight — can be estimated by studying the offset between the average position of the galaxies and the peak in the hot gas.
MACS J0717 is located about 5.4 billion light-years from Earth. It is one of the most complex galaxy clusters ever seen. Other well-known clusters, like the Bullet Cluster and MACS J0025.4-1222, involve the collision of only two galaxy clusters and show much simpler geometry.(c) Mary and Angus Hogg, CC BY-SA 2.0
Geology Lesson Signs of igneous activity in the Torridonian slates at Campa. The thin wriggly white line is a small band of quartz. The broad grey-white rock on the right-hand side is part of a ring-dyke made of felsite.
This spectacular image of sunset on the Indian Ocean was taken by astronauts aboard the International Space Station (ISS). The image presents an edge-on, or limb view, of the Earth’s atmosphere as seen from orbit. The Earth’s curvature is visible along the horizon line, or limb, that extends across the image from centre left to lower right. Above the darkened surface of the Earth, a brilliant sequence of colours roughly denotes several layers of the atmosphere.
Deep oranges and yellows appear in the troposphere, which extends from the Earth’s surface to 6–20 km high. This layer contains over 80 percent of the mass of the atmosphere and almost all of the water vapour, clouds, and precipitation. Several dark cloud layers are visible within this layer. Variations in the colours are due mainly to varying concentrations of either clouds or aerosols (airborne particles or droplets). The pink to white region above the clouds appears to be the stratosphere; this atmospheric layer generally has little or no clouds and extends up to approximately 50 km above the Earth’s surface. Above the stratosphere, blue layers mark the upper atmosphere (including the mesosphere, thermosphere, ionosphere, and exosphere) as it gradually fades into the blackness of outer space.
The ISS was located over the southern Indian Ocean when this picture was taken, with the astronaut observer looking towards the west. Astronauts aboard the ISS see 16 sunrises and sunsets per day due to their high orbital velocity (greater than 28,000 km per hour). The multiple chances for photography are fortunate, as at that speed each sunrise or sunset event only lasts a few seconds! Image acquired with a Nikon D3 digital camera, and is provided by the ISS Crew Earth Observations experiment and Image Science & Analysis Laboratory, Johnson Space Center.Auteur/Créateur: Original téléversé par Elapied sur Wikipédia français., Licence: CC BY-SA 2.0 fr
Recadrage de l'
Auteur/Créateur: Unmismoobjetivo, Licence: CC BY-SA 3.0
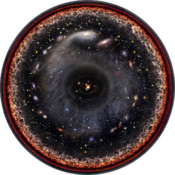
Représentation à l'échelle logarithmique de l'univers observable avec, au centre, le Système solaire, les planètes internes et externes, la ceinture de Kuiper, le nuage d'Oort, Alpha Centauri, le bras de Persée, la Voie lactée, Andromède et les galaxies proches, le réseau des structures à grande échelle, le fond diffus cosmologique et, à la périphérie, le plasma invisible du Big Bang.
Auteur/Créateur: CharlesC, Licence: CC BY-SA 3.0
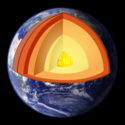
Self-made composition of [1], File:Jordens inre-numbers.svg and core from File:PIA00519 Interior of Ganymede.jpg
The Cosmic Microwave Background temperature fluctuations from the 5-year Wilkinson Microwave Anisotropy Probe data seen over the full sky. The average temperature is 2.725 kelvins (degrees above absolute zero; absolute zero is equivalent to −273.15 °C or −459 °F), and the colors represent the tiny temperature fluctuations, as in a weather map. Red regions are warmer and blue regions are colder by about 0.0002 degree.
pictograms used by the United States National Park Service. A package containing all NPS symbols is available at the Open Icon Library
Auteur/Créateur:
- Original work by mlampret at Openclipart
- Derivative by Kevin Payravi at Wikimedia Commons
Looping arrow icon in blue.


